|
Current Level |
||||||||
|
|
||||||||
|
Generation of Phylogenetic Tree based upon DNA sequence analysis A phylogenetic tree is a type of graph that scientists use to classify related organisms. Traditionally these trees were created using physical traits of organisms such as bone structure, beak shape, etc. More recently molecular data has been used to support and refine these phylogenetic trees. This is done by aligning DNA sequences for a particular gene from several organisms and then applying a program to examine the number of mutations that have accumulated between these sequences. The more accumulated mutations, the more distantly related the two species. Exercise: There are two steps to creating a phylogenetic tree: 1. Aligning the DNA sequences 2. Using the aligned DNA sequences to generate a tree
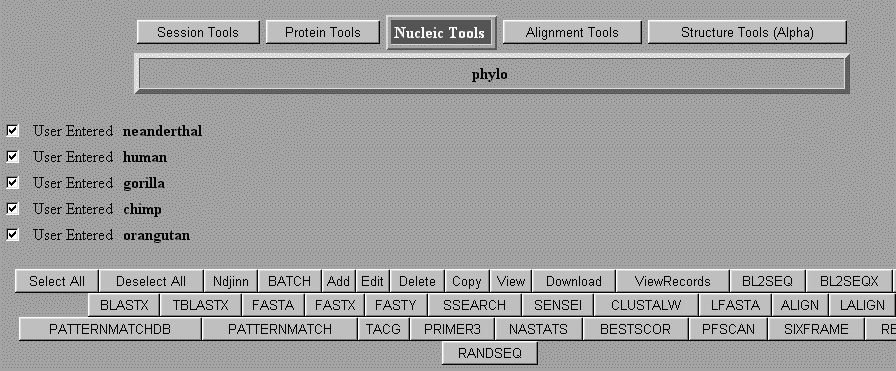
Using Biology WorkBench to align two or more sequences. First we will align DNA sequences from the Mitochondrial D-loop from five species (Human, Chimp, Gorilla, Orangutan and Neanderthal). These sequences can be found at the site Primates . They have also been pasted below. Log onto the Biology WorkBench, select Session Tools and create a new session named phylo. Select Nucleic Tools and then scroll down to Add New Sequence. Create files for each species and paste in the mitochondrial D-loop sequence. Select the sequences that you wish to align by clicking the box next to each file, and then select CLUSTALW.
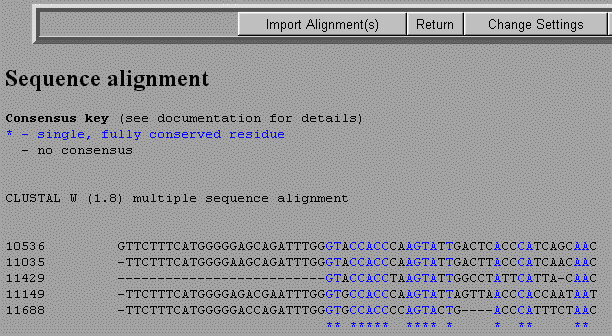
You will now be given some options on parameters you can change in your alignment. You can just use the default values and select Submit at the bottom of the page. The results will show the five sequences with colored letters representing a consensus. Black letters will illustrate a mismatch and dashes will represent gaps.
Select Import Alignment(s). This will save this alignment in a single file for further analysis.
Using Biology WorkBench to create a phylogenetic tree. Next select Alignment Tools select the aligned sequences by clicking the box next to the file name. Next click either the button DRAWTREE or DRAWGRAM. DRAWTREE draws a rooted tree. DRAWGRAM draws an unrooted tree. You will now be given some options on parameters you can change in your alignment. You can just use the default values and select Submit at the bottom of the page. The tree will now appear. Congratulations you are now an evolutionary biologist.
Analysis of trees Examine your tree. Which species appear to be the most closely related? From your tree, does it appear that Neanderthals were direct ancestors of humans, or did we share a common ancestor that branched off from the other apes?
As a further exercise you could try this analysis with 4-5 other species of your choosing.
Example D-loop hypervariable regions from five primate species. >gi|2286205|gb|AF011222.1| Homo sapiens neanderthalensis mitochondrial D-loop hypervariable region 1 >neanderthal_2000 >gi|975204|emb|X90314.1|MTHSWGICB H.sapiens mitochondrial DNA for D-loop (isolate WG+ice37+B) >gi|3766221|gb|AF089820.1|AF089820 Gorilla gorilla beringei mitochondrial D-loop, partial sequence >gi|6288860|gb|AF176766.1|AF176766 Pan troglodytes troglodytes isolate DODO mitochondrial D-loop, partial sequence >gi|1743293|emb|X97708.1|MIPACONTR P.abelii (YN91-227) mitochondrial DNA for control region |
|
|
|

