|
The purpose of this lab exercise is to
acquaint you with some of the publicly available biological databases and
genome analysis tools. Some of these databases and tools you have
used in previous laboratory exercises (e.g. NCBI
Blast, OMIM). Herein, you will be presented with a whirlwind tour of
the interface between biology and computers.
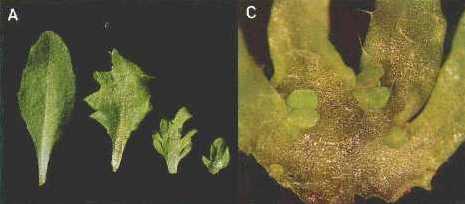
You are conducting research on the model
plant, Arabidopsis thaliana, and have isolated a mutant defective in
leaf development. The leaves become severely lobed (Figure A, the
wild-type leaf is on the left) and form stem-like structures on the leaf
surface (Figure C), as shown below.
You have mapped your mutation to chromosome
four in Arabidopsis, and you wish to isolate and characterize the affected
gene.
1. Open two new browser windows to this page.
2. Go
to The Arabidopsis Information Resource site (TAIR). You will need to open Map Viewer under the Analysis Tools heading. Use the Display box to view the Arabidopsis chromosomes
individually.
How many chromosomes are there in Arabidopsis?
3. Change the Display box to Chromosome 4 to display a map of the
chromosome.
How large is chromosome 4 (cM
or base pairs)?
Why do you suppose the recombination-based
maps (listed in cM) are not all the same size?
For the purposes of this lab, you will only
need to refer to the AGI (Arabidopsis Genome Initiative) map. Note the AGI map is green, other maps
have different colors.
You know your mutation maps between the
markers mi167 and nga8. In the Search window at
the top of the page, type in mi167 and search. To make things easier to view, zoom to
20X (on the left, under the AGI map).
The green bar depicts the chromosome, and the red box shows the part
of the chromosome displayed. To the
right, the markers are listed under the base pair scale. Beneath the markers in the section
labeled AnnotUnits (don’t ask me why
it’s called AnnotUnits) you will find all
the BAC (Bacterial Artificial Chromosome) clones used to determine the DNA
sequence of Arabidopsis.
Where is mi167 located (in Mb) on the
chromosome?
Scroll back up and repeat the search, but this
time use nga8.
Where is nga8 located (in Mb) on the
chromosome?
4. Using the black arrows above the base pair
scale to navigate the chromosome, you can view the clones that make up the contig spanning the region between the two
markers.
What BAC clones make up the contig between markers nga8 and mi167?
5. The planets align properly and finer
mapping experiments indicate that your mutation is likely on BAC
F9M13. Unfortunately, BAC F9M13 is 101,644 bp
long and likely contains many genes.
How can you determine which DNA bases on the
BAC correspond to your mutant gene? How do you know where the
promoters, ORFs, introns,
etc. are in the BAC DNA sequence? Is two hours long enough to find
out if you do this by hand?
6. Double click on the F9M13 tag and you will
get information on the clone. Other organisms that have extensive
genomic sequencing projects have similar web sites (e.g. yeast, mouse,
humans). In the "sequence" area for this clone click on the
genomic link under the Genbank Accession Sequence. This takes you to the
sequence file for BAC F9M13. Copy
the DNA sequence from the sequence file to the clipboard (Yes, all 101,644 bp).
7. Thankfully, there is a program that will
predict (not always accurately!) the locations of all the genes (and ORFs) in the BAC (on both strands of DNA). The
program is called GENSCAN (http://genes.mit.edu/GENSCAN.html). When you get to the GENSCAN site, make sure
you change the organism from "vertebrate" to
"Arabidopsis". Paste you DNA sequence into the
appropriate window and scroll down to click "Run GENSCAN". Be patient, this may take a minute!
How many putative (predicted) genes are on BAC
F9M13?
How many genes are encoded on each strand of
DNA (+ versus -)?
Which gene has the largest number of introns?
Which gene covers the longest stretch of DNA?
8. Mutations that change the fate of
cells are called homeotic mutations.
For example, the Antennapedia mutation
in fruit flies causes legs to grow where the antennae should be.
Because of the change from leaf tissue to stem tissue you suspect that your
mutation may be in a homeotic gene. Such
genes are kind of master control genes; they regulate the transcription of
other genes by binding to specific DNA sequences, called homeoboxes.
How could you determine which predicted
peptides (from GENSCAN) might be homeobox or homeobox-like genes?
9. Your instructor will assign you some of the
predicted peptides to run through BLAST (http://www.ncbi.nlm.nih.gov/BLAST/) in order to
determine the possible functions of the predicted peptides. Keep in
mind you will be doing protein-protein comparisons rather than DNA sequence
comparisons. Simply copy the amino acid sequence from GENSCAN into
the BLAST sequence box.
Which predicted protein is most likely altered
in the mutant Arabidopsis plant?
What is the name of this protein?
Does the GENSCAN predicted amino acid sequence
exactly match the amino acid sequence predicted from the cDNA clone? Why not (take a guess)?
Have similar proteins been cloned in other
organisms? Which ones?
How many homeobox
genes are in Arabidopsis? (HINT: Go to Entrez Genomes at NCBI and search the Arabidopsis genome.)
10. The knat1 gene you have mutated is
similar to knotted 1. To see if other organisms (like people!) have
proteins similar to knotted-1 you return to the NCBI home page (http://www.ncbi.nlm.nih.gov/) and go into the "Entrez
Home" program. Use "knotted 1" as your query. Once you have run the search, click the Gene link.
How many loci were found? In what
organisms?
Choose the GeneID
5316 gene and click on the link.
What does the protein do?
11. You want to know under what conditions the
human PKNOX1 gene is highly expressed and if its expression is suppressed
under other conditions. You would prefer not to have to do all the
work yourself, so you check out the Stanford Microarray
Database (SMD) at the following URL: http://genome-www5.stanford.edu/MicroArray/SMD/. You will be
doing a Public Login. As
there are well over 15,000 total experiments, select human as your
experimental organism before Displaying Data.
How many experiments are there with human
tissue?
Find experiment 2151 dealing with breast
cancer. By examining the Data from this experiment (under Options), you
can see how different genes are expressed in breast tumor cells relative to
normal breast tissue. Currently, you are interested in the PKNOX1
gene. Sort by "Log(base2) of R/G Normalized Ratio (Mean)"
in "Ascending" order and be sure to display "LocusID". Because you are looking for LocusID number 5316, to save time in finding it, you
should Display Rows 5001-5200.
12. Find PKNOX1 (5316) in the list and click
"zoom". This allows you to look at that spot in the microarray. Not very interesting, is it?
Click on the spot to see if the array is just lousy. The array will
have your spot of interest outlined with a yellow square. Note that there
are other green and reddish-brown spots, so the array looks okay.
Click "Back" to get back to your spot, and click "view
expression history". This will show you the R/G ratio for every
array in the database that has measured expression of this same PKNOX1 gene.
If expression varies by a lot in any array, the expression history will
tell us. Ignore the yellow bars, as the hybridization levels were too
low to be reliable in these experiments. Look at the green bars.
Does the expression of the PKNOX1 gene vary
significantly (greater than fourfold) in any of the experiments? (Remember
that the ratios are in Log(base2)).
In which experiment(s) did gene expression
increase significantly?
In which experiment(s) did the expression
decrease significantly?
SUMMARY: Today you have become
acquainted with some of the resources available to save you time and money
when investigating particular phenotypes in any organism, including
humans. As more and more data becomes available, the demand for
people who can exploit (interpret) the information in the databases will
increase. You have also seen (hopefully) that proteins involved in cell
patterning or differentiation can be conserved across species, and even
kingdoms. They may have different roles in each organism, but the
basic protein domains are used over and over to provide great diversity in
form and function of flora and fauna. (It’s all about the
alliteration baby!)
|