|
Current Level |
||||||||||||||||||
|
|
||||||||||||||||||
|
Previous Level |
||||||||||||||||||
|
|
||||||||||||||||||
|
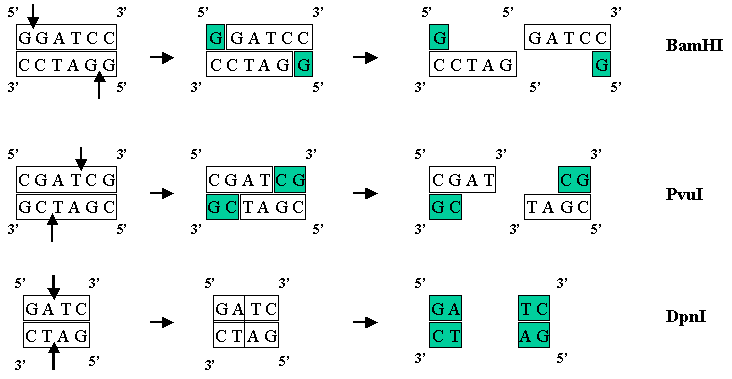
There are hundreds of known enzymes called restriction endonucleases that cleave DNA at very specific sites. For example the enzyme BamHI recognizes the sequence GGATCC and cuts the DNA between the two G's. If just one base is changed in the sequence (say GGTTCC) then the enzyme will not cut the DNA. The 1978 Nobel Prize in Medicine was awarded for research on Restriction Enzymes. Restriction enzymes can cut the DNA such that they leave a 5' overhang (BamHI), a 3' overhand (PvuI), or a blunt end with no overhang (DpnI).
Restriction Enzymes can also be classified by the numbers of bases in the recognition sequence. The numbers of bases will determine the frequency of that specific sequence in an average DNA sequence. For example,
A DNA sequence can be run through a program that will identify these sites in the DNA. The results from this program will show all of the known sites in a given DNA sequence that are cut by restriction enzymes. This "restriction map" is very useful in designing cloning strategies, and in developing diagnostic assays.
We can either use the program TACG directly to generate a restriction map, or use the Biology WorkBench Using Biology WorkBench to generate a restriction map or translation. Log onto the Biology WorkBench and either create a new session or resume an existing session. Select Nucleic Tools. Next select the DNA sequence that you would like to analyze. Push TACG.
You will then be given a screen allowing you to decide which enzymes to use based on numbers of bases in sequence, type of overhang, etc. You can type in the names of individual restriction enzymes if you only want to look at a few. The default is all enzymes. The default will also give you a translation in all six reading frames. Once you have selected the parameters you wish to use, submit your sequence for analysis. For information on interpretation of results click here.
Using TACG to generate a restriction map 1. Select http://codon2.fullerton.edu/tacg3/form.html
7. Scroll down to the button Submit to WWWtacg
GCG-like Ladder Map: The program draws a slash at each site that will be cut by the indicated enzyme.
Table of Fragments: The program gives the predicted sizes of any fragments generated by digestion with each enzyme. For example StuI cuts the DNA at postions 25, 88 and 771.
Pseudo Gel Map: Draws a diagram of the DNA sample digested with each enzyme. The dots each correspond to 100 bp. Fragments smaller than 100 bp are not distinguished. The top of the gel is to the right. For example AceIII generates fragments of approximately 150 bp and 750 bp.
|
|
|
|


