Current Level

 Seq Editor
 Searches
 Seq. Comparison
 Alignment
 Restriction Map
 Translation & ORF
 Reverse Comp
 Primer Design
 Splice Sites
 Genomics
 Protein Motifs
 Protein structure
 Transmembrane

Previous Level

 BioWeb Home
 
 Seq Anal
 Theory
 Bioinformatics
 Mo Bio Lecture
 
 Restriction Map

There are hundreds of known enzymes called restriction endonucleases that cleave DNA at very specific sites.  For example the enzyme BamHI recognizes the sequence GGATCC and cuts the DNA between the two G's.  If just one base is changed in the sequence (say GGTTCC) then the enzyme will not cut the DNA.   

The 1978 Nobel Prize in Medicine was awarded for research on Restriction Enzymes.

Restriction enzymes can cut the DNA such that they leave a 5' overhang (BamHI), a 3' overhand (PvuI), or a blunt end with no overhang (DpnI).

Restriction Enzymes can also be classified by the numbers of bases in the recognition sequence.  The numbers of bases will determine the frequency of that specific sequence in an average DNA sequence.  For example, 

DpnI recognizes a 4 bp sequence with would occur once every 44 or 256 bp.

PvuI recognizes a 6 bp sequence with would occur once every 46 or 4,096 bp.

NotI recognizes an 8 bp sequence with would occur once every 48 or 65,536 bp.


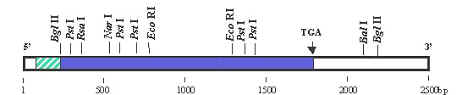
A DNA sequence can be run through a program that will identify these sites in the DNA.  The results from this program will show all of the known sites in a given DNA sequence that are cut by restriction enzymes.  This "restriction map" is very useful in designing cloning strategies, and in developing diagnostic assays.


We can either use the program TACG directly to generate a restriction map, or use the Biology WorkBench

Using Biology WorkBench to generate a restriction map or translation.

    Log onto the Biology WorkBench and either create a new session or resume an existing session.  Select  Nucleic Tools.

    Next select the DNA sequence that you would like to analyze.  Push TACG.

Tacg

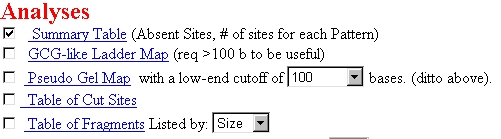
You will then be given a screen allowing you to decide which enzymes to use based on numbers of bases in sequence, type of overhang, etc.  You can type in the names of individual restriction enzymes if you only want to look at a few.  The default is all enzymes.  The default will also give you a translation in all six reading frames.

Once you have selected the parameters you wish to use, submit your sequence for analysis.

For information on interpretation of results click here.


 Using TACG to generate a restriction map

     1.  Select http://codon2.fullerton.edu/tacg3/form.html 

     2.  In the box below the heading Sequence Entry paste in your DNA seqeunce.  Be sure there are no blank spaces, returns, or letters other than a, c, g or t. 

     3.  Try your first run with the default settings.  Scroll down to the button Submit to WWWtacg

     4.  Your results will come back in several formats.  As a table of enzymes that cut and do not cut, and as a map, showing the location of the cut sites. 

     5.  If you wish to only see where a few specific enzymes cut the DNA, go back to the submission page.  Under Restriction Enzyme Selection by...  push the button next to by ...Explicit Pick from List.  Now scroll up and select the desired enzyme(s).

     6. The program will also perform several other calculations on your sequence if you select that feature.  Note that  you can also tell the computer if you are digesting linear or circular DNA.

imageE8F
 
      • Summary Table dispays the names of all enzymes that do not cut the DNA sequence and the number of times that other enzymes do cut the DNA.
      • GCG-like Ladder Map shows the positions of each restriction site on a graphical map of the DNA.
      • Pseudo Gel Map shows a diagram of the fragments that would be generated if you cut the DNA with the indicated enzyme and ran the DNA on an agarose gel.
      • Table of Cut Sites displays a list of each enzyme and the position(s) at which it will cut the DNA.
      • Table of Fragments gives the sizes of fragments generated by digesting the DNA with each enzyme.
                      

     7.  Scroll down to the button Submit to WWWtacg


Interpretation of Results

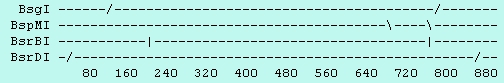
     GCG-like Ladder Map:  The program draws a slash at each site that will be cut by the indicated enzyme. 

imageNPH
 
        •  The "/" on BsgI indicates that a 3' overhang is generated.
        • The "\" on BspMI indicates that a 5' overhang is generated.
        • The "!" on BsrBI indicates that a blunt end is generated

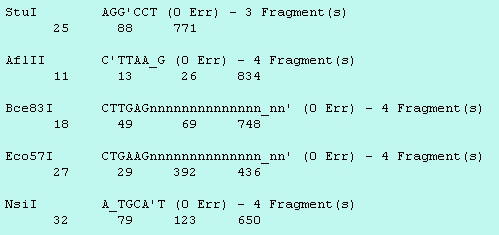
      Table of Fragments:   The program gives the predicted sizes of any fragments generated by digestion with each enzyme. 

      Table of Cut Sites:  The program gives the predicted recognition sites for each enzyme.  

            For example StuI cuts the DNA at postions 25, 88 and 771.

imagePQJ
 
    • The " ' " symbol indicates where the enzyme will cut the DNA on that strand. 
    • The " _ " symbol indicates where the enzyme will cut the DNA on the complementary strand.


    • StuI cuts both strands in the same place, generating a blunt end.
    • AflII cuts both strands towards the 5' end of the recognition sequence, leaving a 5' overhang.
    • NsiI cuts both strands towards the 3' end of the recognition sequence, leaving a 3' overhang.
    • Bce83I and Eco57I both cut the DNA at sites 14 bp from the recogntion sequence.

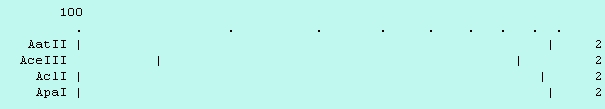
     Pseudo Gel Map:  Draws a diagram of the DNA sample digested with each enzyme.  The dots each correspond to 100 bp.  Fragments smaller than 100 bp are not distinguished.  The top of the gel is to the right.  For example AceIII generates fragments of approximately 150 bp and 750 bp. 

image77A


uwsa_l5

 © 2003 The Board of Regents of the University of Wisconsin System.

Click here to email comments to Scott Cooper regarding this site or its links.